Abstract
Background: The incidence of cancer is on the rise in South Africa and globally. However, literature on the current and expected future burden of cancer in the country is lacking.
Aim: To develop a model that forecasts the incidence of five of the most commonly diagnosed cancers in South Africa. The model aims to estimate the true underlying burden of cancer, as opposed to diagnosed cases only.
Setting: South Africa.
Methods: Age-specific incidence rates for each cancer are forecasted for the period 2019–2030, based on a combination of public and private sector cohort data. It is assumed that historical trends in changes in the incidence rate of cancer will continue over the forecasting period. Forecasted incidence rates are applied to population forecasts to find the total number of incident cancer cases for the relevant year.
Results: The incidence of all cancers included in this research is increasing over time, with the total number of cases just less than doubling between 2019 and 2030 (from approximately 62 000 to 121 000 incident cases). This is a result of increases in the age-specific incidence rate of cancer, as well as the growth and ageing of the South African population.
Conclusion: Results confirm that cancer is a major and growing public health problem in South Africa. This highlights the need for increases in resources available for cancer services, as well as rapid implementation of cancer prevention strategies, to reduce the number of future cancer cases, and thereby reduce the burden on the health system.
Keywords: cancer; incidence; non-communicable disease; public health; South Africa.
Introduction
Cancer is a fast-growing health priority around the world. It is estimated that one in nine individuals will develop cancer in their lifetime, and cancer is currently the second leading cause of global mortality.1 The global incidence of cancer has been increasing over time and is expected to continue to do so. This can be explained by demographic changes, such as population growth and ageing (the risk of cancer increases considerably with age2) as well as epidemiological reasons, such as increased exposure to risk factors (e.g. pollution and alcohol).3
While cancer is a global health concern, the burden of cancer is disproportionately felt in low- and middle-income countries (LMICs), where the majority of new cancer cases3 and 70% of cancer deaths occur.1 The persistence of infectious diseases as a major public health concern for LMICs has led to a substantial proportion of health spending going to infectious diseases. It is also true that donor funding in LMICs tends to be oriented towards communicable rather than non-communicable diseases (NCDs). The lack of both domestic and donor funding4,5 has led to poor access to cancer prevention, screening and diagnostic services (which leads to late-stage diagnosis and poorer health outcomes), as well as low levels of access to quality cancer treatment in many LMICs.3
As an NCD, cancer forms part of the quadruple disease burden faced by South Africa.6 It is also a leading cause of mortality in the country, accounting for 10% of national deaths.6 These high rates of cancer mortality can, in part, be explained by the inequities that exist in access to cancer prevention, screening, diagnosis and treatment that lead to poorer health outcomes.7 The most commonly diagnosed cancers in South African women are breast, cervical, basal cell carcinoma, squamous cell carcinoma and colorectal cancer, while the most commonly diagnosed cancers in men are prostate, basal cell carcinoma, squamous cell carcinoma, colorectal and lung cancers.8 The National Cancer Strategic Framework (NCSF): 2017–2022,7 developed by the South African National Department of Health (NDoH), outlines the country’s plan for achieving equitable access to cancer services for the South African population.
The NCSF recommends an integrated approach to cancer prevention, given the large overlap of risk factors for cancer and other NCDs. Common NCD risk factors, including tobacco use (which is estimated 22% of global cancer deaths that can be attributed to tobacco use), alcohol use, lack of physical activity, unhealthy diet and obesity, are also associated with higher risk of cancer.9 The World Health Organization (WHO) estimates that approximately one-third of global cancer deaths can be attributed to these common NCD risk factors,9 highlighting the value of targeting NCDs and cancer together with an integrated approach.
Additionally, the high prevalence of human immunodeficiency virus (HIV) in South Africa contributes considerably to the burden of cancer in the country, both in terms of incidence and mortality. Human immunodeficiency virus is biologically associated with increased risk of various cancers, including lymphoma, cervical cancer and Kaposi’s sarcoma.10 However, successful antiretroviral treatment (ART) in people living with HIV (PLWHIV) has reduced excess risk of cancer in recent years,11 as well as improved treatment outcomes in this population.12 Given that human papilloma virus (HPV) is a sexually transmitted infection, contracting HPV is associated with many of the same risk factors as HIV. It is therefore difficult to establish the extent of a causal link between HIV and increased risk of cervical cancer (which is caused by HPV). In addition to an increased risk of developing cancer, PLWHIV also tend to have worse treatment outcomes.13
Despite the high incidence of cancer in South Africa, there is a lack of recent and reliable cancer data (the most recent National Cancer Registry [NCR] report that is publicly available is from 2017), which complicates estimating and understanding the true burden of cancer. As a result, there is little existing literature on the current and expected future disease burden.
This study uses multiple data sources across the South African public and private sectors to forecast the incidence of some of the most common cancers in South Africa from 2019 to 2030. Forecasting the cancer burden can support better and more available healthcare services, using the evidence to plan for the resource need. South Africa is moving towards Universal Health Coverage (UHC) and understanding the disease burden is critical to ensure there are sufficient resources to deliver quality care for all South Africans irrespective of socio-economic status.
Methods
A model that forecasts the annual incidence of five of the most common cancers in South Africa was developed in Microsoft ExcelTM. The model includes forecasts for female breast, cervical, prostate, lung and haematological (disaggregated into lymphoma, leukaemia, multiple myeloma and all other haematological cancers grouped together) cancers as well as paediatric cancers from 2019 to 2030.
South African population forecast
The total South African population is drawn from the NDoH’s population estimates (October 2020).14 These estimates are used for health planning and ensure that the population estimates in the model are aligned to nationally accepted data. The population data are broken down by 5-year age bands, separated by gender and projected from 2019 through to 2030. The population data show growth in the South African population between 2019 and 2030, particularly in the older age bands, indicating that the population is ageing (Figure 1).
 |
FIGURE 1: Changes in share of public sector population structure: 2020–2030. |
|
The South African private sector population (those who are members of a private medical scheme) is estimated using the Council for Medical Schemes (CMS) data,15 which produces an annual report detailing the utilisation and expenditure in the medical scheme environment. It also provides updated figures on the number of medical scheme users. This number does not include anyone who may have used private sector services but chose to pay for them ‘out of pocket’, as is common particularly for general practitioner (GP) care. Therefore, the private sector population estimate is a representation of medical scheme beneficiaries rather than all those who use the private sector (which is higher than the number of beneficiaries).
The total number of beneficiaries (i.e. the total medical scheme population) has been static for several years (variation within 1%) and is assumed to remain so over the forecasted period. However, the proportion of beneficiaries across the age groups shows variation from one year to the next. Given that CMS data prior to 2014 do not detail data by age and gender, the average trend observed between 2014 and 2018 was used to forecast the proportion of beneficiaries in the relevant age groups up to 2030. It is assumed that the change in the spread of beneficiaries by age and gender between 2014 and 2018 is an accurate representation of the ageing trends that we expect for this population in the future.
Finally, the public sector population is the total population less the private sector population. This method is used because there is no official data source that estimates the public sector population. The CMS data (disaggregated by age and gender sub-groups) are subtracted from the related total population age and gender sub-group. The public sector population is ageing. The 40–49 age band grows considerably over time, accounting for 11% of the total share of the population in 2020 and 15% in 2030. The 50–59 age band shows a one percentage point increase, as does the 70+ age group. These changes have a negative impact on the cancer burden, given the positive relationship between age and cancer.
The model also requires the projection of PLWHIV for the cancers that are related to HIV (e.g. cervical cancer). The Thembisa model16 is the foremost South African HIV projection model. It is used by the NDoH in its decision-making for HIV-related funding. The breakdown of total forecasted PLWHIV by age and gender is therefore obtained from the Thembisa model.
Human immunodeficiency virus prevalence in the private sector population is projected by applying the 2017 CMS age and gender-specific HIV prevalence rates per 1000 beneficiaries to the projected beneficiary numbers. The prevalence criteria used, as per the CMS 2017–2018 Annual Report, are the following: ‘beneficiaries registered on the schemes’ chronic disease management programme for each Chronic Disease conditions during the year under review’. The HIV prevalence in the private sector population is assumed to remain static, given that this has been the historical trend.15 For each age and gender sub-group, HIV prevalence in the public sector population is calculated by subtracting the number of PLWHIV in the private sector from the number of PLWHIV as per the Thembisa model.
Data used for incidence forecasting
The age and gender-specific incidence rates of each cancer are forecasted using historical data from the NCR and Discovery Health Medical Scheme (DHMS). The NCR is meant to act as the consolidated repository of all cancer data in South Africa (across both the public and private sectors).
However, it only includes cancers that were identified through pathology testing. The DHMS data are only for medical scheme beneficiaries belonging to DHMS. Discovery Health Medical Scheme has approximately 2.7 million beneficiaries (just over 30% of the total South African medical scheme members). Discovery Health Medical Scheme is an ‘open’ medical scheme, meaning anyone who would like to, and can afford to, may join. The patient profile therefore tends to be of a higher socio-economic status, given that the beneficiaries are not predominantly funded through employer contributions. Incidence in the DHMS population is estimated based on registration on the scheme’s oncology programme.
Incidence forecasting
Age and gender-specific incidence rates are forecasted based on the following two assumptions:
- Trends in cancer incidence observed in historical data are representative of future trends in cancer incidence.
- The annual change in incidence rate remains constant over the period (this assumption is made because there were no trends in annual changes in the incidence rate observable in the data over the period included in analysis).
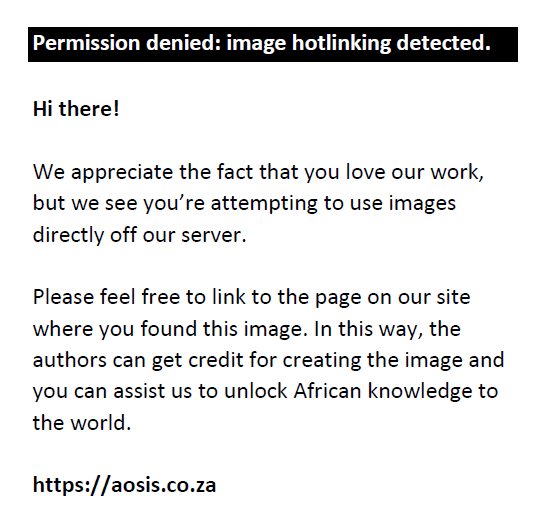
The constant annual change in the age and gender-specific incidence rates used for forecasting is estimated separately for each cancer and data set (NCR and DHMS). This is done by finding the average annual change in the age-standardised incidence rate observed in the historical data for each cancer. Trends in the age-standardised incidence rate were used owing to insufficiently large data samples when considering age and gender-specific sub-groups separately. Therefore, the same annual change in incidence rate is applied to all age and gender-specific incidence rates for a particular cancer. This constant annual change is then applied to the incident rate in a previous year to find the incident rate in the following year (Equation 1). This is done separately for the NCR and DHMS data sets.
Equation 1: Formula for forecasting incidence rate of cancer:
A weighted average of the forecasted annual age and gender-specific incidence rates (there are two sets of incidence rates: one based on the NCR data and the other based on the DHMS data) is then applied to the relevant population sub-group for each year. This is done separately (using different weights for the weighted average) for the population serviced by the public and private sectors, respectively (the population serviced by the private sector is assumed to be those individuals with medical scheme cover), to match the demographic and risk factor profiles of the relevant population most closely. Higher incidence rates are observed in the DHMS data for most cancers (cervical cancer has a higher incidence in the NCR data), and this is understood to be a result of better case finding in the private sector. Therefore, the application of a weighted average of NCR and DHMS data to forecast incidence attempts to more accurately capture true underlying incidence of cancer (as opposed to using NCR data only, which captures pathology diagnosed incident cancer only), particularly in the public sector population. Table 1 shows the data source weightings used for each cancer for the public and private sectors, respectively.
| TABLE 1: Weighting of incidence data sources. |
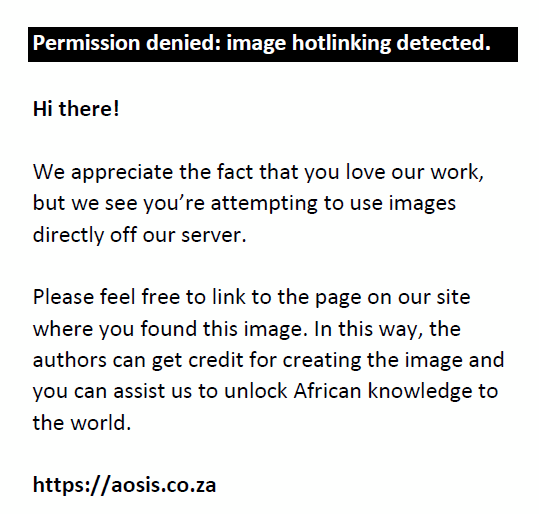
Risk-adjusted incidence rates are used to estimate the incidence of cancers associated with HIV (cervical cancer and lymphomas) in PLWHIV. This is done by applying risk ratios to the age and gender-specific incidence rates of these cancers in PLWHIV, as per Equation 2. In the absence of age and gender-specific risk ratios, the same risk ratio was applied across all age and gender-specific incidence rates for each cancer. The risk ratio applied to the incidence rate of cervical cancer, Hodgkin’s lymphoma and non-Hodgkin’s lymphoma (NHL) in PLWHIV are 1.7,17 1.2217 and 2.73,10 respectively. These risk ratios are from a national study of the South African population that uses the NCR data together with HIV data from the National Health Laboratory Services between 2004 and 2014. Given the time period of the analysis, these risk ratios implicitly account for the protective effects of ART in PLWHIV to some extent. However, the same risk ratios are applied over the forecasting period (2019–2030), which may overestimate the increased risk of cancer in PLWHIV over time given that it is forecasted that ART coverage in South Africa will increase over the forecasting period.16
Equation 2: Formula for application of risk ratio to age and gender-specific incidence rate in PLWHIV:
Incidence forecasts were done by applying forecasted age and gender-specific incidence rates of cancer to the relevant sub-group (age and gender specific) of the forecasted population each year.
Peer review
Interviews with clinical experts took place throughout the course of this research. This ensured optimal data collection and informed model structure and methodology.
Ethical considerations
Ethical clearance to conduct the study was obtained from the University of Stellenbosch (clearance number: N20/01/002). Secondary data from the public and private sectors were to estimate the total burden of disease.
Results
Model forecasts show that the incidence of all cancers included in the model is increasing over time. The total number of incident cancer cases more than doubles over the forecasting period, from 61 957 in 2019 to 120 969 in 2030. The reasons for this are demographic and epidemiological. The South African population is growing and ageing, and there exists a strong association between cancer and age. In addition, the model forecasts increases in the age-specific incidence rate of cancer. This could be a result of various factors, for example, environmental or dietary factors.
The majority of cancer incidence (ranging between 80% and 90% over the forecasted period) occurs in the public sector population. This is to be expected, given that the majority of the population (~84%) rely on the public health sector. However, given the higher case-finding rate in the private sector, the incidence rate in the private sector is expected to be higher than that of the public sector overall.
Table 2 summarises the total incidence across the cancers studied from 2019 to 2030. Each year represents the newly diagnosed cancer clients entering the system.
| TABLE 2: Summary of incidence across cancers, 2019–2030. |
As shown in Figure 2, female breast cancer, cervical cancer and prostate cancer have the highest incidence. The incidence of NHL is increasing at the highest rate, followed by prostate cancer and then cervical cancer.
 |
FIGURE 2: Total forecasted cancer incidence in South Africa, 2019–2030. |
|
Given the high prevalence of HIV in the country, the association between HIV and cervical cancer and HIV and lymphoma is prominent. The model forecasts that between 30% and 40% of cases of cervical cancer and lymphoma occurs in PLWHIV. Around 20% of incident Hodgkin’s lymphoma cases occur in PLWHIV. Figure 3 shows the projected incidence of the cancers associated with HIV in PLWHIV.
 |
FIGURE 3: Forecasted cancer incidence in people living with HIV, 2019–2030. |
|
Female breast cancer
Female breast cancer is the cancer with the highest incidence for women. The higher case finding rate in the private sector, owing to better access to screening for medical scheme members, translates to higher incidence rates of breast cancer in the private sector population (110.1 per 100 000 population in 2020) compared to the public sector population (59.5 per 100 000 population in 2020). Therefore, a comparatively high proportion of breast cancer is diagnosed among in medical scheme members (while medical scheme members make up only around 16% of the total population, 20% – 25% of incident cases occur in this population). When looking at the public sector only, breast cancer is the cancer with the second highest incidence in women (cervical cancer has the highest incidence rate) over the entire period.
Cervical cancer
Cervical cancer is one of the most common cancers in South Africa. The vast majority (94% – 96%) of incident cases of cervical cancer, as per model projections, occur in the public sector population. In contrast to other cancers, the incidence rate observed in the NCR data is much higher than that observed in the medical scheme data, which can largely be explained by the difference in exposure to risk factors, including HIV, for cervical cancer across the public and private sectors. Many of the socio-economic risk factors that drive the high prevalence of HIV in the public sector, such as poverty that makes adolescent girls and young women vulnerable to intergenerational sex, are also risk factors for cervical cancer, which is caused by HPV, a sexually transmitted infection. Furthermore, differences in preventative screening measures can influence differences in incidence across sectors.
Prostate cancer
Prostate cancer is the most common male cancer in South Africa. Similar to breast cancer, the incidence rate of prostate cancer is much higher in the private sector population (109.5 per 100 000 population in 2020) compared to the public sector population (57.4 per 100 000 population in 2020) and can be explained by the higher case finding rate in the private sector, owing to better access to screening for medical scheme members. For this reason, the model projects that a comparatively high proportion of prostate cancer is diagnosed among male medical scheme members (15% – 25%).
Lung cancer
Lung cancer has a relatively high incidence in both women and men, with the majority of lung cancer cases occurring from ages 50 onwards. Historical data show that the incidence of lung cancer is increasing at a much higher rate in women than in men. This trend continues over the forecasting period. As a result, while the incidence rate of lung cancer in 2019 is higher in men (11.0 and 9.3 per 100 000 population for men and women, respectively), the same is higher in women by 2030 (12.9 and 16.8 per 100 000 population for men and women, respectively).
Haematological cancers
The haematological cancers have a higher incidence at younger ages than other cancers, but the majority of cases still occur in older ages (30+ years). This is largely driven by the fact that leukaemia and lymphoma are two of the most common paediatric cancers. The incidence of haematological cancers is increasing at a high rate over time, and this is largely driven by increases in the incidence of NHL (which accounts for most haematological cancer cases), which can be explained by the close association between HIV and NHL.
Paediatric cancers
Overall, the incidence of paediatric cancers is relatively low. The incidence of cancer in girls is slightly higher than that in boys and the incidence differs across various age bands for both boys and girls (Table 3). The relative incidence numbers across the age groups are driven by different cancers. The increase in incidence over time is also much less steep than for adult cancers. This can be explained by the fact that the South African population is ageing, as well as the low incidence rate of paediatric cancers.
| TABLE 3: Summary of paediatric cancer incidence by age, 2019–2030. |
Discussion
The incidence of breast, cervical, prostate, lung, haematological and paediatric cancers is on the rise in South Africa and is expected to continue to grow over the next decade. This increasing incidence can be attributed to both population growth and changes, as well as changes in the incidence rate of cancer over time.
The forecasted cancer incidence aligns with other South African data sources.8 The expected increase in incident cancer in South Africa (a doubling by 2030) is also consistent with existing literature. According to the WHO Report on Cancer (2020), the number of cancer cases is expected to double over the next 20 years, with the majority of increases occurring in LMICs.1 While lung cancer is the cancer with the highest incidence rate globally, followed by breast cancer, the relative incidence of types of cancer differs across geographies. For example, a higher incidence of infection-related cancers is expected in LMICs (where 25% of cancers are caused by infections).1 In South Africa, infection-related cancers, such as cervical cancer and Kaposi sarcoma, are among the most commonly diagnosed cancers.8 This is consistent with our model forecasts, which identifies cervical cancer (which is caused by HPV) as one of the three cancers with the highest incidence.
The high prevalence of HIV in the public sector is a key driver of the increasing incidence of cervical cancer, Hodgkin’s lymphoma and NHL (two of the cancers with incidence increasing at the fastest rate). Approximately one-third of these cancers occur in PLWHIV. Given the reduction in risk of developing these cancers and the improved treatment outcomes that are associated with successful ART in PLWHIV, ensuring that PLWHIV receive and adhere to treatment is a cost-effective way to reduce the incidence of HIV-related cancers while simultaneously preventing other HIV and AIDS-related morbidity.
Inequities in access to cancer services in South Africa are evident in the higher incidence of cancer in private sector data compared to public sector data. This can be explained, in part, by higher levels of access to screening and diagnostic services in the private sector, which result in better case finding in the private sector. To account for these differences and more accurately model true underlying incidence (as opposed to diagnosed cases only), final incidence forecasts used are a weighted combination of public and private sector data. As such, model incidence forecasts are expected to be somewhat higher than reported incidence in the NCR (diagnosed cases only) over the forecasting period (2019–2030), unless substantial improvements in access to cancer services in the public sector are realised.
This research has also highlighted the need for better and more timely data. Without these, disease statistics are likely an inaccurate estimation of the true need. This impedes the system’s ability to match resources to requirement and respond to shifts in patient needs. Accurately estimating the burden of disease is vital as South Africa shifts towards achieving UHC under its anticipated National Health Insurance (NHI), where capacity will likely be expanded by contracting from the private sector. This expansion, given the scale of the projected need, has large financial consequences. Therefore, understanding the true burden and cost is a prerequisite for a financially resilient NHI.
The rising burden of cancer forecasted in our model highlights the need to increase the resources available for cancer services in South Africa. The WHOs four pillars for cancer care provide guidance for how countries can move towards better services. There is an increased need for human resources, screening and prevention activities, treatment services (including equipment and maintenance thereof), medication and palliation services. This will require strategic planning for cancer services. In the context of South Africa and its narrowing fiscal climate, ensuring that limited resources are used most efficiently is critical. A re-engineering of the way in which cancer services are planned and budgeted is therefore recommended. This would include cancer as part of the broader NCDs planning and funding, given the strong overlap in risk factors for these diseases. A holistic and integrated model of care would be a more cost-efficient and effective approach to cancer prevention and control.
The various assumptions that inform the model forecasts presented in this research should be taken into consideration when interpreting the results. The assumption that annual changes in the incidence rate of cancer will remain constant over time (i.e. linear growth) may not be accurate and may lead to under- or overestimation of cancer incidence over time. Additionally, the assumption that the same annual change in the incidence rate is applied across all age bands for each cancer (calculated as the observed average annual age-standardised change in incidence rate in the historical data) may not accurately represent changes in age-specific incidence rates over time.
In forecasting incidence, the model also assumes that past trends in cancer incidence (as observed in the data between 2010 and 2017) will continue over the forecasting period and do not account for any behavioural (such as smoking trends or ART coverage and use) or environmental changes (such as exposure to carcinogens) that are not embedded in historical trends in the data. This assumption therefore implies that historical changes in any such factor and the impact thereof on cancer risk will continue over the forecasting period. Specifically, the model does not explicitly account for future changes in ART use and coverage (which are expected to improve over time), given that the risk ratios applied to the PLWHIV remain constant over the forecasting period. As such, the model forecasts may overestimate the incidence of cancers associated with increased risk in PLWHIV.
Conclusion
The rising burden of cancer in South Africa (attributable to both demographic and epidemiological changes), as forecasted by the modelling detailed in this article, highlights the need to increase resources available for cancer services in the country. The findings of the report highlight the need for rapid implementation of cancer prevention strategies to reduce the number of future cases of cancer and thereby to reduce the burden on the health system. Planning for cancer services should be evidence based to ensure that resource allocation is commensurate with the expected burden of disease and associated costs. This requires the availability of relevant, recent and reliable data. At present, such data are not publicly available. This highlights the need for comprehensive incidence and costing data across both the public and private sectors.
Acknowledgements
The authors would like to acknowledge Discovery Health Medical Scheme and the National Cancer Registry for their gracious sharing of data. The authors would also like to acknowledge all the oncologists and specialists who provided information, guidance and peer review during the project.
Competing interests
The authors declare that they have no financial or personal relationships that may have inappropriately influenced them in writing this article.
Authors’ contributions
E.F. carried out data cleaning, data analysis, modelling and drafting of the article. J.W. carried out data collection (qualitative and quantitative), review and editing of the modelling and the article and project administration.
Funding information
This work was funded by the Cancer Alliance (South Africa).
Data availability
The National Cancer Registry data are available at: https://www.nicd.ac.za/centres/national-cancer-registry/cancer-statistics/. Medical scheme claims data from the Discovery Health Medical Scheme (DHMS) were de-identified.
Disclaimer
The views and opinions expressed in this article are those of the authors and do not necessarily reflect the official policy or position of any affiliated agency of the authors.
References
- World Health Organization. World Cancer Report: Cancer research for cancer prevention. Geneva: World Health Organization (IARC); 2020.
- White MC, Holman DM, Boehm JE, Peipins LA, Grossman M, Jane Henley S. Age and cancer risk: A Potentially modifiable relationship. Am J Prev Med. 2014;46(3):S7–S15. https://doi.org/10.1016/j.amepre.2013.10.029
- WHO. WHO report on cancer: Setting priorities, investing wisely and providing care for all. Report No.: 9789240001299. Geneva: World Health Organization; 2020.
- Knaul F, Horton S, Yerramilli P, Gelband H, Atun R. Chapter 17: Financing cancer care in low-resource settings. In: Cancer: Disease control priorities [homepage on the Internet]. 3rd ed. Washington, DC: The International Bank for Reconstruction and Development / The World Bank; 2015. Available from: https://www.ncbi.nlm.nih.gov/books/NBK343629/
- Jailobaeva K, Falconer J, Loffreda G, Arakelyan S, Witter S, Ager A. An analysis of policy and funding priorities of global actors regarding noncommunicable disease in low- and middle-income countries. Global Health. 2021;17(1):68. https://doi.org/10.1186/s12992-021-00713-4
- Statistics South Africa. Mortality and causes of death in South Africa: Findings from death notification [homepage on the Internet]. 2018 [cited 2021 Jan 11]. Available from: http://www.statssa.gov.za/publications/P03093/P030932018.pdf
- Department of Health Republic of South Africa. National Cancer Strategic Framework for South Africa 2017–2022 [homepage on the Internet]. Ethics in health research principles, processes and structures. 2nd ed. 2017. Available from: http://www.nhrec.org.za/docs/Documents/EthicsHealthResearchFinalAused.pdf
- National Cancer Registry. Cancer in South Africa: 2019 full report [homepage on the Internet]. [cited 2022 May 23]. Available from: https://www.nicd.ac.za/wp-content/uploads/2021/12/NCR_Path_2019_Full_Report_8dec2021.pdf
- World Health Organization. Cancer [homepage on the Internet]. WHO Library; 2021 [cited 2021 Feb 11]. Available from: https://www.who.int/health-topics/cancer#tab=tab_1
- Franceschi S, Lise M, Clifford GM, et al. Changing patterns of cancer incidence in the early-and late-HAART periods: The Swiss HIV Cohort Study. Br J Cancer. 2010;103(3):416–422. https://doi.org/10.1038/sj.bjc.6605756
- Lymphoma Action. Lymphoma and HIV Community forum [homepage on the Internet]. Lymphoma Action. 2019 [cited 2021 Jan 11]. Available from: https://lymphoma-action.org.uk/types-lymphoma-lymphoma-and-other-conditions/lymphoma-and-hiv
- American Cancer Society. Treating HIV-associated lymphoma [homepage on the Internet]. American Cancer Society; 2018 [cited 2021 Jan 11]. Available from: https://www.cancer.org/cancer/non-hodgkin-lymphoma/treating/radiation-therapy.html
- Re A, Cattaneo C, Rossi G. HIV and lymphoma: From epidemiology to clinical management. Mediterr J Hematol Infect Dis. 2019;11(1):e2019004. https://doi.org/10.4084/mjhid.2019.004
- South African National Department of Health (NDoH). Population estimates. Pretoria: South African National Department of Health (NDoH). October 2020.
- The Council for Medical Schemes. Council of medical schemes annual report 2019/2020. Volume 17. Council of medical schemes annual report 2019/2020. Johannesburg: The Council for Medical Schemes. 2020; p. 1–9.
- Johnson L, May M, Dorrington R, et al. Estimating the impact of antiretroviral treatment on adult mortality trends in South Africa: A mathematical modelling study. PLoS Med. 2017;14(12):e1002468. https://doi.org/10.1371/journal.pmed.1002468
- Grulich AE, Van Leeuwen MT, Falster MO, Vajdic CM. Incidence of cancers in people with HIV/AIDS compared with immunosuppressed transplant recipients: A meta-analysis. 2007;370(9581):59–67. https://doi.org/10.1016/S0140-6736(07)61050-2
| 